
MARKET OVERVIEW
Fresh geopolitical uncertainties did not completely deter the spring Commercial Real Estate market. Transaction volume of the four major asset groups could reach nearly $80 billion, according to an analysis of CoStar data. This would represent a 15%, 12-month growth rate. War-fueled inflation took the anticipated Federal Reserve rate cuts off the table, and the benchmark 10-year treasury1 soared in May. “People are trying to get active and put money to work,” Chad Lavender2 of Newmark told Bisnow. Indeed, with $378 billion in dry powder, debt funds entering the investor pool, and Q1 loan originations up 52%, there was ample liquidity.
Retail was the favored investment, breaking the Office sector's streak. Shifting price momentum may have played a role; the CoStar Commercial Repeat Sale Indices for office properties posted a 9.9% annual jump in March. The overall index rose 3.8% in April. Although cap rates have been steady so far this year, distress has ticked up. The Mortgage Bankers Association (MBA) delinquency rate in Q1 rebounded to just over 4%.
CoStar’s May sector reports showed steadying fundamentals. Office’s Q1 lease activity3 was the highest since 2018. Trophy space demand4 surpassed historical averages. Vacancies trended down below 14% and rent growth skipped up to 1.5%. However, the market continued to work through older and less competitive inventory.
Retail demand cooled slightly in response to softer consumer sentiment5, though backfilling activity remained robust. Low inventory additions kept vacancies at 4.4% and rental growth normalized as it slid nearer to the historical average. Multifamily moved closer to balance, with vacancies slightly improving and rent growth hitting 0.5%. The return of 6-plus % mortgage rates and employment concerns also impeded move-outs.
Despite healthy demand for new, automation-ready industrial space, elevated inventory levels kept vacancy and rent growth rates flat. A temporary increase in warehouse utilization occurred as retailers advanced purchases to mitigate wartime risk.
As of early May, CoStar’s database showed more than 770 data centers under construction or proposed – a monumental expansion – but there were strengthening headwinds, including construction costs, increasingly inquisitive local governments, and local resident opposition.
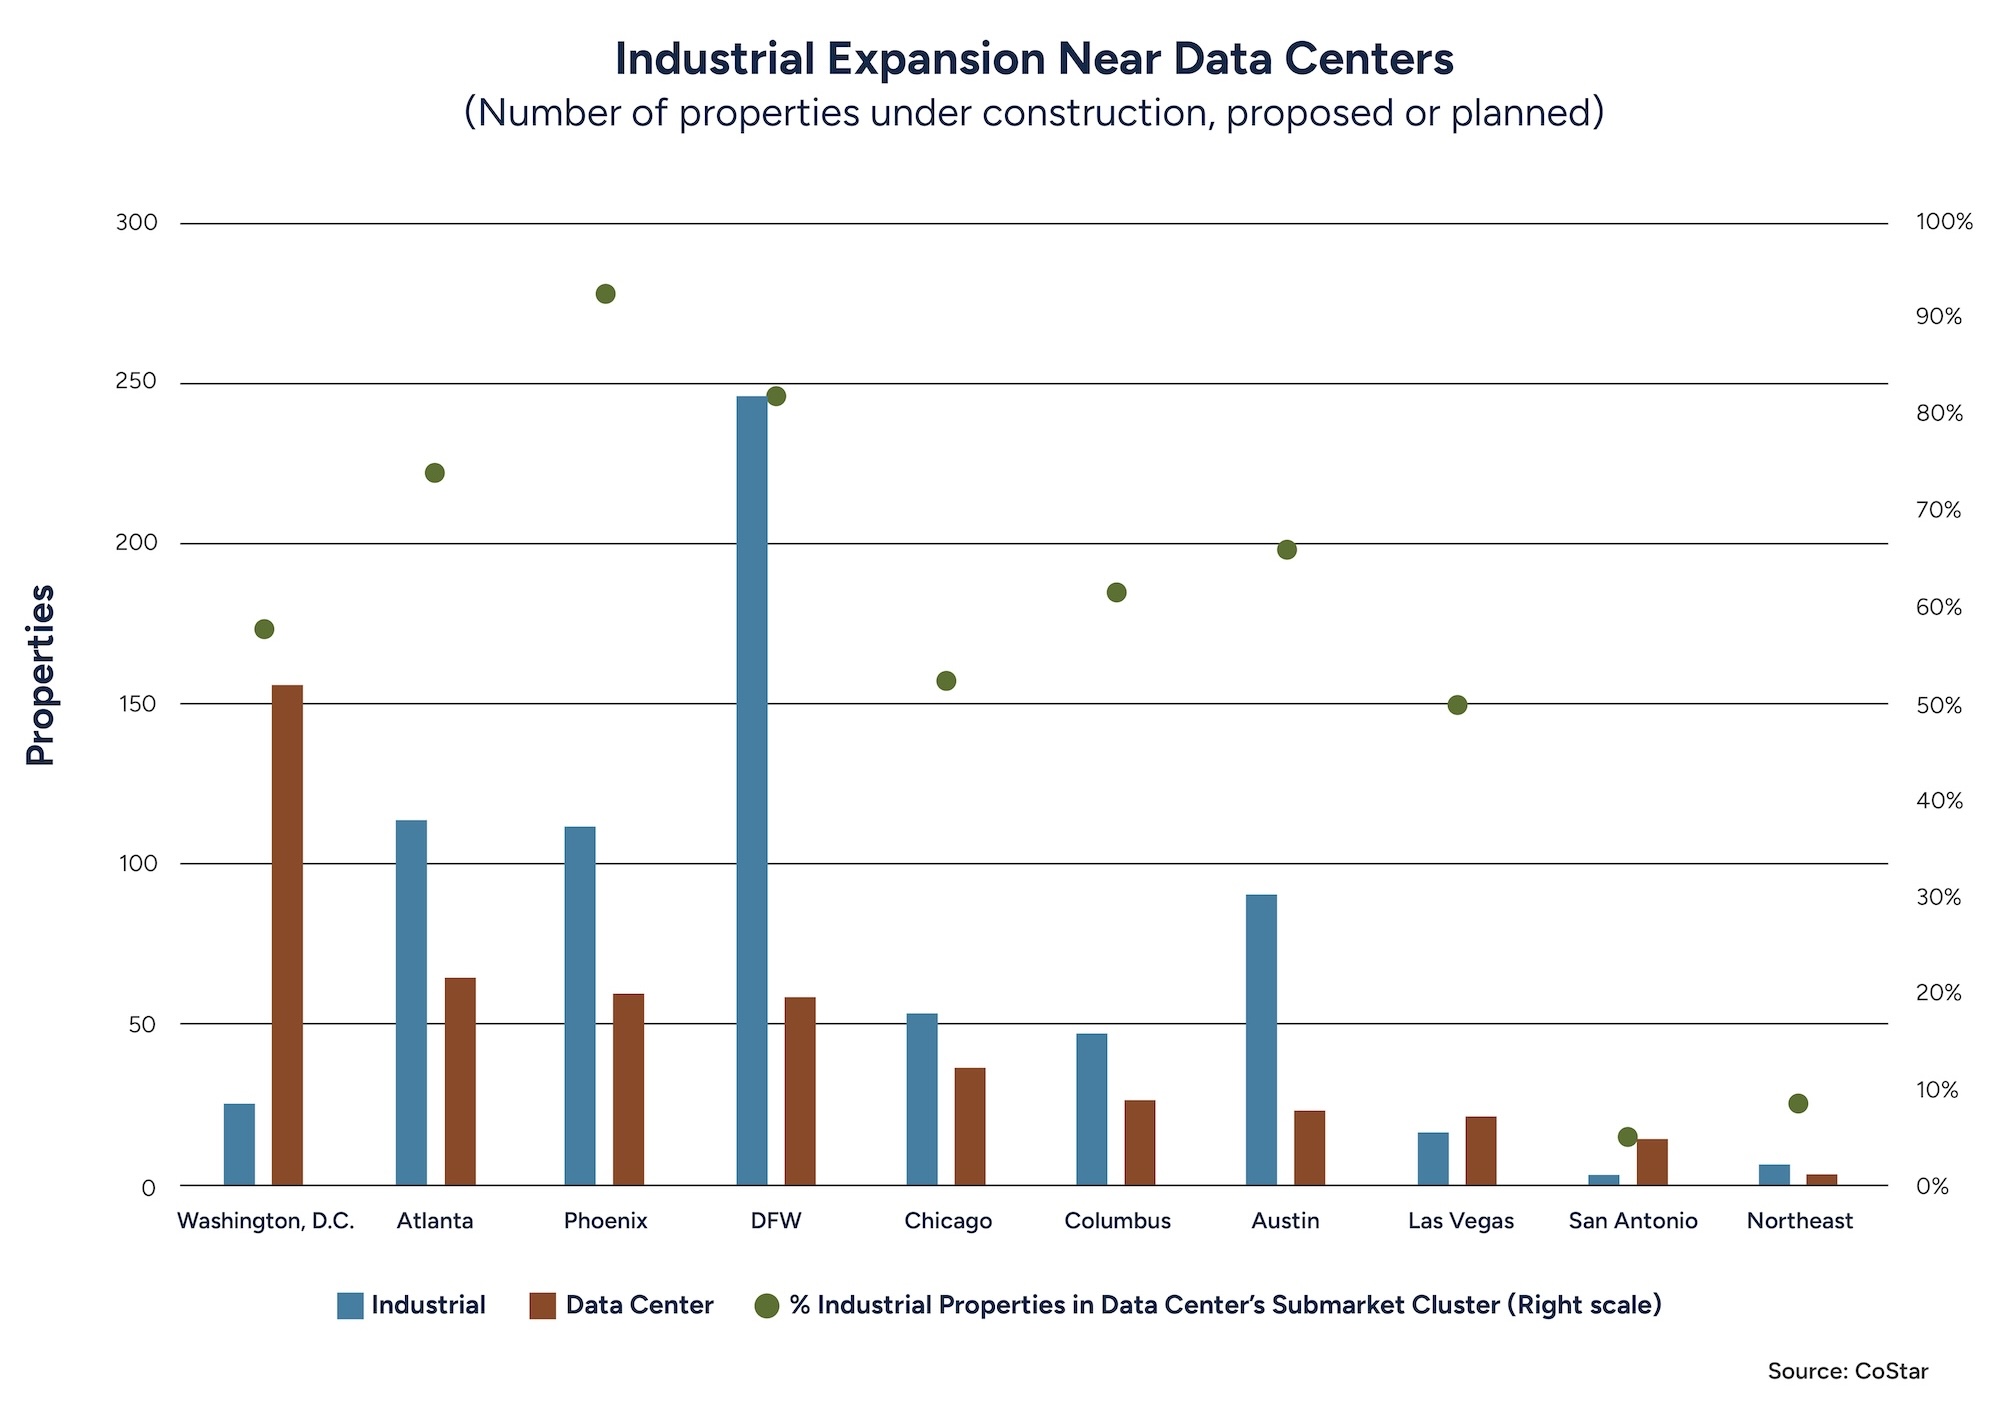
A DEEPER LOOK: INDUSTRIAL GROWTH NEAR DATA CENTERS
Growth in data center development appears to be driving increased industrial activity. The chart below highlights several of the most concentrated data center markets as of early May. Almost all the markets have over 50% of their upcoming industrial properties in close proximity to planned data center projects. A key factor is whether data centers are expanding into new submarket clusters.
For example, the Dallas-Fort Worth (DFW) metroplex has experienced a significant increase in industrial development, particularly near the emerging data center hub in the South Dallas subcluster market. Thirty new data centers are under development, with 41 industrial properties underway. Although Atlanta, Austin, and Phoenix have similar property numbers, Phoenix’s industrial building is almost all near data centers. Since Phoenix’s data center hub formation is relatively new, industrial support is likely playing catchup. It also includes new semiconductor-related construction.
Other markets will see existing submarket clusters just getting denser. This is the case for Washington, D.C., the largest existing and expanding data center market, where 70% of new data centers will be near established hubs. Further, with over a decade of significant development, its industrial support is well established. The same is true for San Antonio, where its industrial growth spurt may have stabilized.
Lately, new data centers are being developed away from the traditional localities. A look at this map may give us an idea of where selective industrial development may follow.
WHAT'S NEXT?
Find out how the second quarter of 2026 ends and what’s on the horizon for summer in Old Republic Title’s next Economic Update.
Sources:
1 Board of Governors of the Federal Reserve System (US), Market Yield on U.S. Treasury Securities at 10-Year Constant Maturity, Quoted on an Investment Basis [DGS10], retrieved from FRED, Federal Reserve Bank of St. Louis; https://fred.stlouisfed.org/series/DGS10, May 27, 2026.
2 Bisnow, “FIRST DRAFT LIVE: Newmark Capital Markets Head Chad Lavender Says CRE Debt Markets 'Almost Insatiable.” Reprinted with permission May 2026.
3 Bisnow, “U.S. Office Market Starts 2026 With A Bang As Tenants Sign Most Leases In A Decade.” Reprinted with permission May 2026.
4 Avison Young, "Q1 2026 U.S. office market overview.” Reprinted with permission May 2026.
5 University of Michigan. “Surveys of Consumers: Final Results for May 2026.” Reprinted with permission May 2026.