
MARKET OVERVIEW
Market appetite shrank over the last few months, reflecting further tightened credit conditions and unease over the “wall of maturities” (the amount of commercial debt coming due in the next three years) heading for refinancing. Compared to a year ago, annual deal volume was down 63 percent in the second quarter, per MSCI. The decline was also a hangover from the heady days of 2022, when transactions hit a record high. Cap rates steadfastly rose to pre-pandemic or above levels. Despite prices dropping at a good pace, further price adjustments are needed to help markets reengage. This is a necessary, albeit painful, step to reach a stable post-pandemic market condition. The Office sector is clearly the most vulnerable, where there is potential distress, functionally obsolete space and a plateau in the return to office numbers.
Most asset classes still possessed underlying strengths throughout the second quarter of 2023. According to JLL, total retail vacancies stayed at 4.2 percent despite high-profile bankruptcies. Hotel, bolstered by the travel boom, was the only asset class with positive price growth over the last year. Apartment transactions and prices have fallen from their lofty heights in 2022, but the asset class remained the most active. Student housing was particularly attractive; its “recession proof” rent growth outpaced that of multifamily apartments. Industrial came back to earth a bit, but deal volume was still 24 percent ahead of its average, as reflected in MSCI’s Capital Trends quarterly report. Vacancies rates also crept up, attributed more to a surge in deliveries than softening demand.
While not apparent in market activity, there were supportive financial developments. Economic performance was better than expected. Uncertainty over interest rates fell; the consensus is that the Fed may only raise rates once more this year. CRE originations rebounded 23 percent in the second quarter, according to the Mortgage Bankers Association. MSCI reported that the largest banks were more active than regional ones in lending for office properties and in metros with larger price declines. It was these same banks that just passed the government’s stress test. Thus, banks most exposed to losses may also be the ones that can absorb them best. The Federal Reserve recently gave very unsubtle signals to modify and accommodate upcoming CRE maturities. This “amend and extend” approach may smooth out the impact of troubled loans.
A DEEPER LOOK – REGIONAL INDUSTRIAL SECTOR TRANSACTION PRICES
According to MSCI, industrial transaction prices fell 2.8 percent in the last year, by far the lowest of the larger asset classes. Looking at the graph below, we can see that the declines were not uniform around the country.
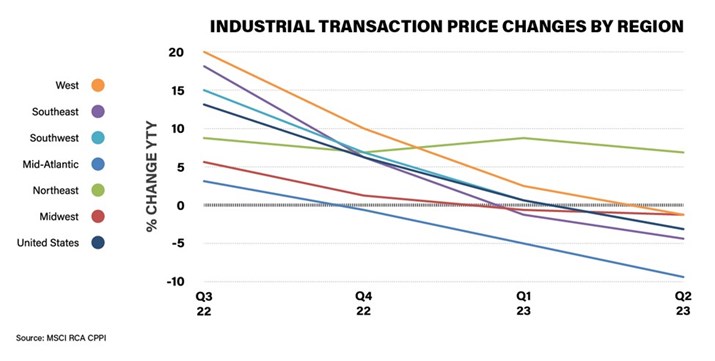
The Northeast region’s prices were solidly in positive territory, around 8 percent for the last four quarters. Within the region, it was areas outside major metros, like New Haven and Hartford, Connecticut, that had significant transaction growth this year to date. The Western region experienced one of the largest drops in prices year to year. Industrial properties have not been immune to the economic issues in the San Francisco and San Jose metros. Their weak performance masked rebounds in Seattle, Washington and Southern California’s Inland Empire. The Philadelphia, Pennsylvania metro weighed down the Mid-Atlantic region, which has steadily declined since the third quarter of 2021. A moderation in the declines in the Washington D.C. metro area this year may prop up the region’s results going forward.
WHAT’S NEXT?
Stay tuned for next month’s Economic Update 3Q 2023 to see where the economy stands before the holidays.